Line chart data representation is used to show the trend of a certain topic or data for a specific course. The line graph data representation is commonly used by google in most of their products, for example, google trends and google analytics.
This shows representing data to users using line graphs or charts is a recommended way and it allows the user to view the progress of the data that is being tracked. The line graphs clearly show where there are high peaks and whether the trend is upward or downward.
The focus of this article is to describe how you can generate line charts using PHP and MySQL having data stored in the database.
This article is a continuation of the last article which we discussed how to generate line graphs using PHP and MySQL whereby we highlighted in detail what is required and what each function does
For this article, we shall go direct to show you how to generate line charts on a web page.
- First, you need to add the chart loader JavaScript file that is provided by gstatic in the head section of your website
<script type="text/javascript" src="https://www.gstatic.com/charts/loader.js"></script>
- Next you will need to define where the line chart will be displayed once it is generated.
We use a div and assign it an id which we will link with it later once the line chart is generated
<!--location where the line chart will be displayed-->
<div id="line-chart-location">
</div>
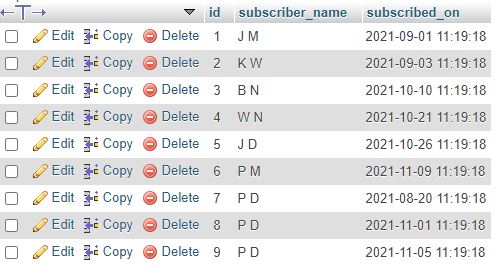
- Next, you will need to have the data ready in the MySQL database that you want to display in a line chart
For this article, we are using a table for saving subscribers and we shall group them by month so that we can monitor the monthly trend
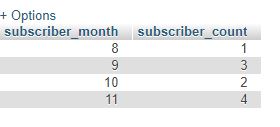
- Next, we define the SQL query that will fetch the result from the database and group it in terms of months (you can also display daily, weekly, or even individual rows)
The SQL query for the data represented in the image above is as follows
SELECT MONTH(subscribed_on) AS subscriber_month, COUNT(*) AS subscriber_count FROM subscribers GROUP BY MONTH(subscribed_on)
The result for the above query will group the data as shown in the image below
- Next, you will now add the SQL code above to PHP queries combined with the chart JavaScript as shown below to generate the line charts
<?php
$chkresults = mysqli_query($con,"SELECT MONTH(subscribed_on) AS subscriber_month, COUNT(*) AS subscriber_count FROM subscribers GROUP BY MONTH(subscribed_on)");
?>
<script type="text/javascript">
google.charts.load('current', {'packages':['Line']});
google.charts.setOnLoadCallback(drawChart);
function drawChart() {
var data = google.visualization.arrayToDataTable([
['Month','Subscribers'],
<?php
while($row=mysqli_fetch_assoc($chkresults)){
echo "['".$row["subscriber_month"]."',".$row["subscriber_count"]."],";
}
?>
]);
var options = {
chart: {
title: '',
},
bars: 'vertical',
vAxis: {format: 'decimal'},
height: 300,
colors: ['#d95f02']
};
var chart = new google.charts.Line(document.getElementById('line-chart-location'));
chart.draw(data, google.charts.Line.convertOptions(options));
}
</script>
Having followed the above steps correctly, the line chart will be generated when you run the codes.
The full code for generating line charts using PHP and MySQL is as shown below
<?php
include_once("includes/db_connect.php");
?>
<html>
<head>
<!--chart js -->
<script type="text/javascript" src="https://www.gstatic.com/charts/loader.js"></script>
</head>
<body>
<?php
$chkresults = mysqli_query($con,"SELECT MONTH(subscribed_on) AS subscriber_month, COUNT(*) AS subscriber_count FROM subscribers GROUP BY MONTH(subscribed_on)");
?>
<script type="text/javascript">
google.charts.load('current', {'packages':['Line']});
google.charts.setOnLoadCallback(drawChart);
function drawChart() {
var data = google.visualization.arrayToDataTable([
['Month','Subscribers'],
<?php
while($row=mysqli_fetch_assoc($chkresults)){
echo "['".$row["subscriber_month"]."',".$row["subscriber_count"]."],";
}
?>
]);
var options = {
chart: {
title: '',
},
bars: 'vertical',
vAxis: {format: 'decimal'},
height: 300,
colors: ['#d95f02']
};
var chart = new google.charts.Line(document.getElementById('line-chart-location'));
chart.draw(data, google.charts.Line.convertOptions(options));
}
</script>
<!--location where the line chart will be displayed-->
<div style="width:50%" id="line-chart-location">
</div>
</body>
</html>
The following image shows the result of the above code
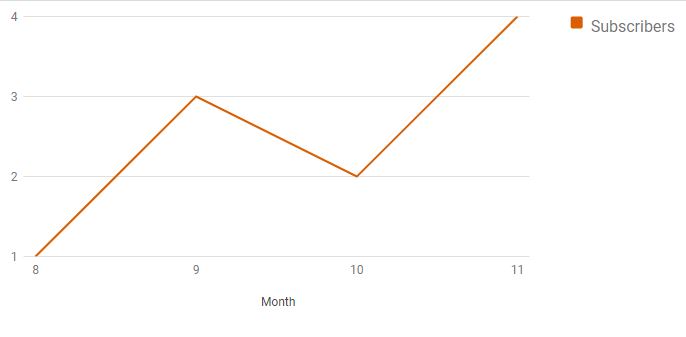
You can use your own custom data and note the behavior of the line chart. It works with real-time data whenever the correct process is followed. That’s how we generate line charts using PHP, MySQL, and JavaScript