Data representation and visualization are much needed while developing software applications since it is the best way for those who are not software developers to understand better.
For software developers, it is easier to interpret data in any format but for non-developers, it is recommended that they be provided with a way they can view the data at a grasp.
Bar graphs are used to represent data in an easier way such that one can track the results of either a product or service. For example, suppose you have a product and you want to view how customers are registering month by month, a bar graph can help track this since it will show the trend whether its upwards or downwards
In this article, we shall discuss how to generate bar graphs using PHP and MySQL in that if you have data in a MySQL database, you can display it using bar graphs
- First, you will need to include the chart js that is supported by Google. Full charts reference can be found in google charts developer module https://developers.google.com/chart
<script type="text/javascript" src="https://www.gstatic.com/charts/loader.js"></script>
Remember the chart js should be initialized before executing the graph codes
- Next, you will need to define the area where the bar graph will be displayed by defining an id attribute in a div
<div id="bar-graph-location">
</div>
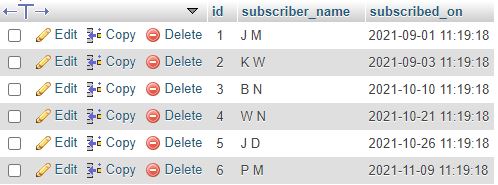
- Next, you will need to have your data ready in the MySQL database
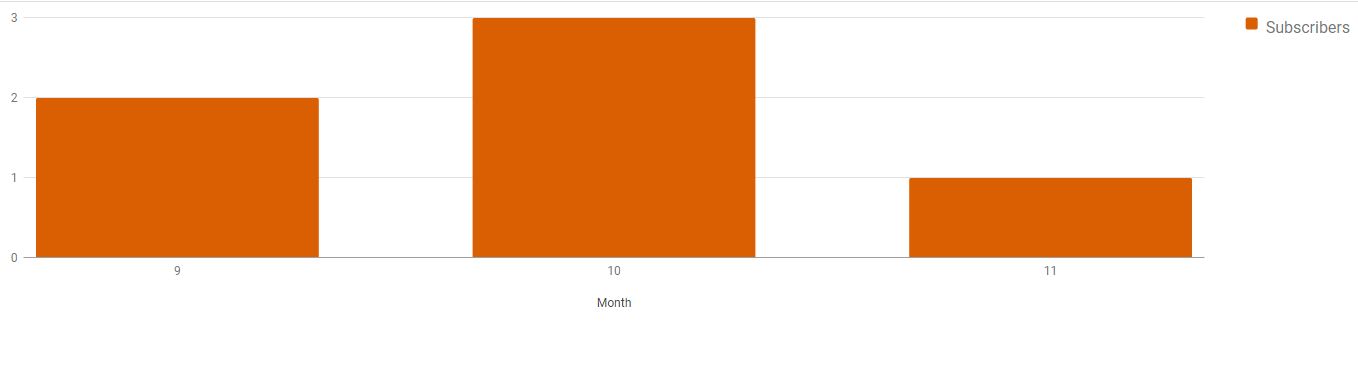
For this demonstration, we will use subscribers’ data for the month of September, October, and November
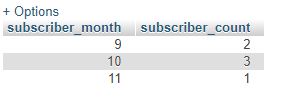
In the image above, there are 2 subscribers for September, 3 for October, and 1 for November. This is after calculating the count grouped by each month using the SQL code shown below
SELECT MONTH(subscribed_on) AS subscriber_month, COUNT(*) AS subscriber_count FROM subscribers GROUP BY MONTH(subscribed_on)
The result is shown in the image below
To generate a bar graph using PHP and MySQL, add this code below
<?php
$chkresults = mysqli_query($con,"SELECT MONTH(subscribed_on) AS subscriber_month, COUNT(*) AS subscriber_count FROM subscribers GROUP BY MONTH(subscribed_on)");
?>
<script type="text/javascript">
google.charts.load('current', {'packages':['Bar']});
google.charts.setOnLoadCallback(drawChart);
function drawChart() {
var data = google.visualization.arrayToDataTable([
['Month','Subscribers'],
<?php
while($row=mysqli_fetch_assoc($chkresults)){
echo "['".$row["subscriber_month"]."',".$row["subscriber_count"]."],";
}
?>
]);
var options = {
chart: {
title: '',
},
bars: 'vertical',
vAxis: {format: 'decimal'},
height: 300,
colors: ['#d95f02']
};
var chart = new google.charts.Bar(document.getElementById('bar-graph-location'));
chart.draw(data, google.charts.Bar.convertOptions(options));
}
</script>
The code above explained
- The MySQL query fetches data from the database and assigns it to $chkresults variable
- The google.charts.load defines the kind of chart to be loaded, we have specifically outlined the bar graph is the one we want to display
- The function draw chart collects the data from the MySQL database and converts it to the format applicable by the JavaScript chart
- The var options add additional features to the chart, for example, the title of the chart, the orientation of the chart, the height of the chart, and the bar colors of the chart
- var chart = new google.charts.Bar(document.getElementById('bar-graph-location'));
chart.draw(data, google.charts.Bar.convertOptions(options)); combines with the div we had created such that when the chart is drawn is it displayed inside the div specified
The result for the above code is represented in the image below
The full code for displaying the bar graph using PHP and MySQL is as below
<?php
include_once("includes/db_connect.php");
?>
<html>
<head>
<!--chart js -->
<script type="text/javascript" src="https://www.gstatic.com/charts/loader.js"></script>
</head>
<body>
<?php
$chkresults = mysqli_query($con,"SELECT MONTH(subscribed_on) AS subscriber_month, COUNT(*) AS subscriber_count FROM subscribers GROUP BY MONTH(subscribed_on)");
?>
<script type="text/javascript">
google.charts.load('current', {'packages':['Bar']});
google.charts.setOnLoadCallback(drawChart);
function drawChart() {
var data = google.visualization.arrayToDataTable([
['Month','Subscribers'],
<?php
while($row=mysqli_fetch_assoc($chkresults)){
echo "['".$row["subscriber_month"]."',".$row["subscriber_count"]."],";
}
?>
]);
var options = {
chart: {
title: '',
},
bars: 'vertical',
vAxis: {format: 'decimal'},
height: 300,
colors: ['#d95f02']
};
var chart = new google.charts.Bar(document.getElementById('bar-graph-location'));
chart.draw(data, google.charts.Bar.convertOptions(options));
}
</script>
<!--location where bar graph will be displayed-->
<div id="bar-graph-location">
</div>
</body>
</html>
To add the actual month names other than numbers, you can use the if else method and match the correct month number with the name.
That’s how we generate bar graphs using PHP and MySQL using the chart features provided by Google Charts
You can draw bar graph using any data type provided it follows the structure provided. Use other examples to test this feature. Happy coding